http://denCity.net
page overview:
- impression - illustration of a new city-perception
- Introduction - Brief introduction into denCity.net
- maps - Explanation of some map-functions
- Text - detailled explanation of the project
- map features - practical examples with descriptions
- sample maps - Examples
practical examples with descriptions
|
denCity-maps discover invisible contexts and densities of the city, thus extending its usability and changing the perception of the city.
The maps visualise virtual densities in the urban information landscape. On http://denCity.net - and from your mobile (via WAP) - you could for instance generate a WLAN-map, which shows the coverage of a certain part of the city with wireless LAN hotspots. Then you may add further parameters and see, which areas of the city best comply with your demands.
On this page we will show some explanatory examples (maps are taken directly from the map-engine of dencity.net). The next page will then show a larger selection of maps with direct links to the parametric online maps.
Please activate javascript to see interactive effects. map 1-a


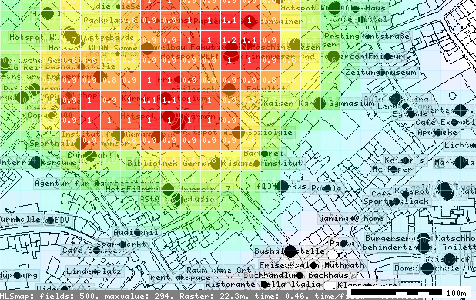
This map shows the WLAN-density in a selected area of the city. The map is divided into smaller fields (the gridsize is adjustable). All coloured fields feature at least one AccessPoint within the set radius of 100 m. Fields with the value 1 indicate the highest hotspot-concentration.
map 1-b


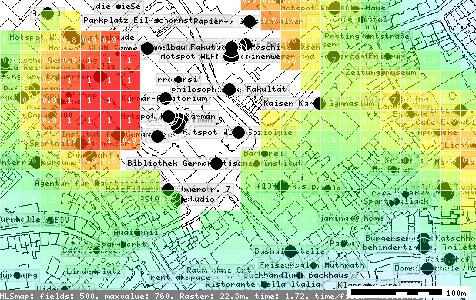
The same part of the city is mapped looking at the overlapping of WLAN-Hotspots and gastronomy facilities. Fields with a value now each feature at least one tag in the category 'AccessPoint' as well as at least one in 'gastronomy'; both categories have been set to a radius of 100 m. Combining various search parameters, the image of the density map is completely altered and shows sudden transitions between fulfillment and non-fulfillment of the conditions.
map 2


This example shows the virtual net of real places that is formed by so called Intralinks.
Users can create these Intralinks by associatively adding references amongst tags. A short description of the objective can be assigned to each reference.
This creates - without requiring local vicinity - neighbourhoods of tags. map 3


The label-function explains each tag in the map, giving useful information (like opening hours etc.), guestbook entries etc.
|